∆∆ Our Journey So Far∆∆.
PORTFOLIO DATA ANALYTICS TEAM7
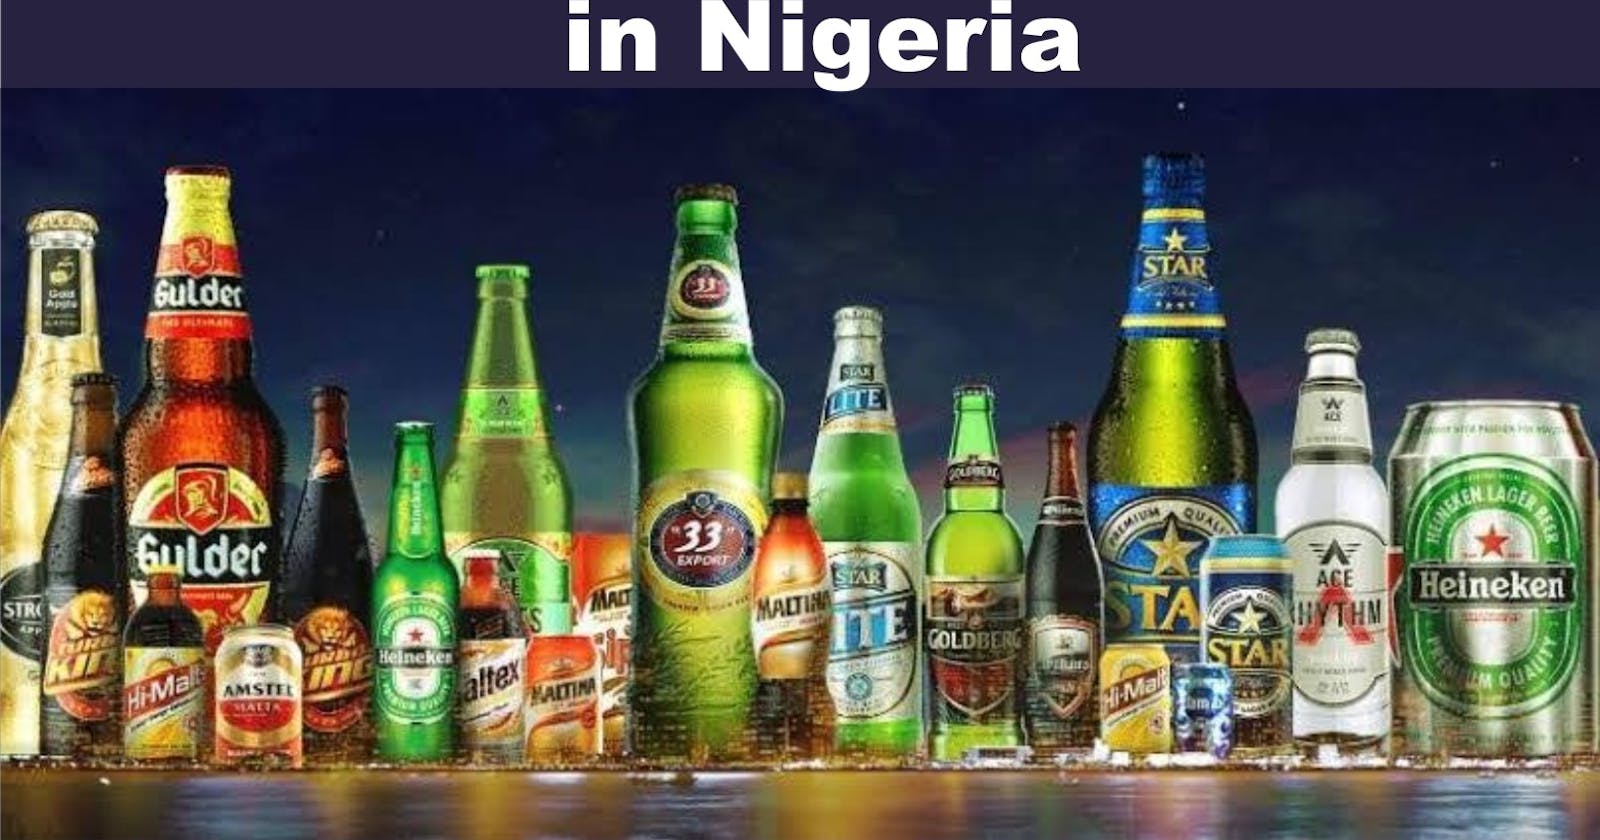
#PROJECT TITLE: PRODUCT SALES INSIGHT OF DRINKS CONSUMED BY NIGERIANS
#Project Description: The Project given to us is to Analysis and present Visualizations of a Product consumed by the Nigeria.
#Project Duration: Monday 6th June - Saturday 11th June 2022
#In dealing with the Project as a Data Analyst, knowing that "Data are just summaries of thousands of stories tell a few of those stories to help make the data meaningful" we try to understand the project and creat an imaginary picture of the outcome of the project and best presentation of the Finished Project. in achieving our goal, this are the process we engaged in.
BRAINSTORMING: We brainstormed as a team on the best presentation of the project, divided the task at hand, and Intercommunicated for efficient Project delivery and also come upon a consensus about the dataset to use. Which is a Nigeria Drink Dataset for the Project.
#DATA SCRAPPING: Next was to use different search engines to search for suitable Dataset that will meet out Project requirements, and then we got one.
#DATA CLEANING: Next step was to Carry out cleaning of the Dataset to make sure all information are properly inputted and in the right format for Analysis.
#DATA VISUALIZATIONS:Data visualization is representing information in graphical form, as a pie chart, graph, or another type of visual presentation which helps people make sense of all the information, or data so generated.
In doing this we Did our Analysis of the data on Microsoft Excel and Power BI, for proper visualizations of the Dataset.
#The Nigeria Brewery company comprises of So many Different product brands ranging from Alcohol to None Alcoholic drinks and also the Other Brand company, The industry has More the A hundred Brand, employing directly and indirectly Thousands of person.
#In Reporting and Visualizations of our Data, about the Drink used in Nigeria we try to Help Our Data user to easily interact with the data set, where with a click, you can know the Total Sales, cost, quantity, Profit for each Product Brand, for each Region in Nigeria, for each Month, for each Year and also Each Sales Rep. and also more. We also Arranged our visuals for simple and informative understanding of the whole dataset so that Business Decisions can be made easily and information relating to the dataset can be easily gotten.
#Our Challenges concerning this project are the Data Scrapping process where it looks like the dataset was not in existence, and also the Analysis process of the data, but our Triumph moments are the intercommunication synergy of team members, the division of task and achieving them on time and exhilarating feeling of the the Finished Project which came out even better than we preconceived. For all Files and doc check : drive.google.com/folderview?id=1N4lKCWFuD7r..
